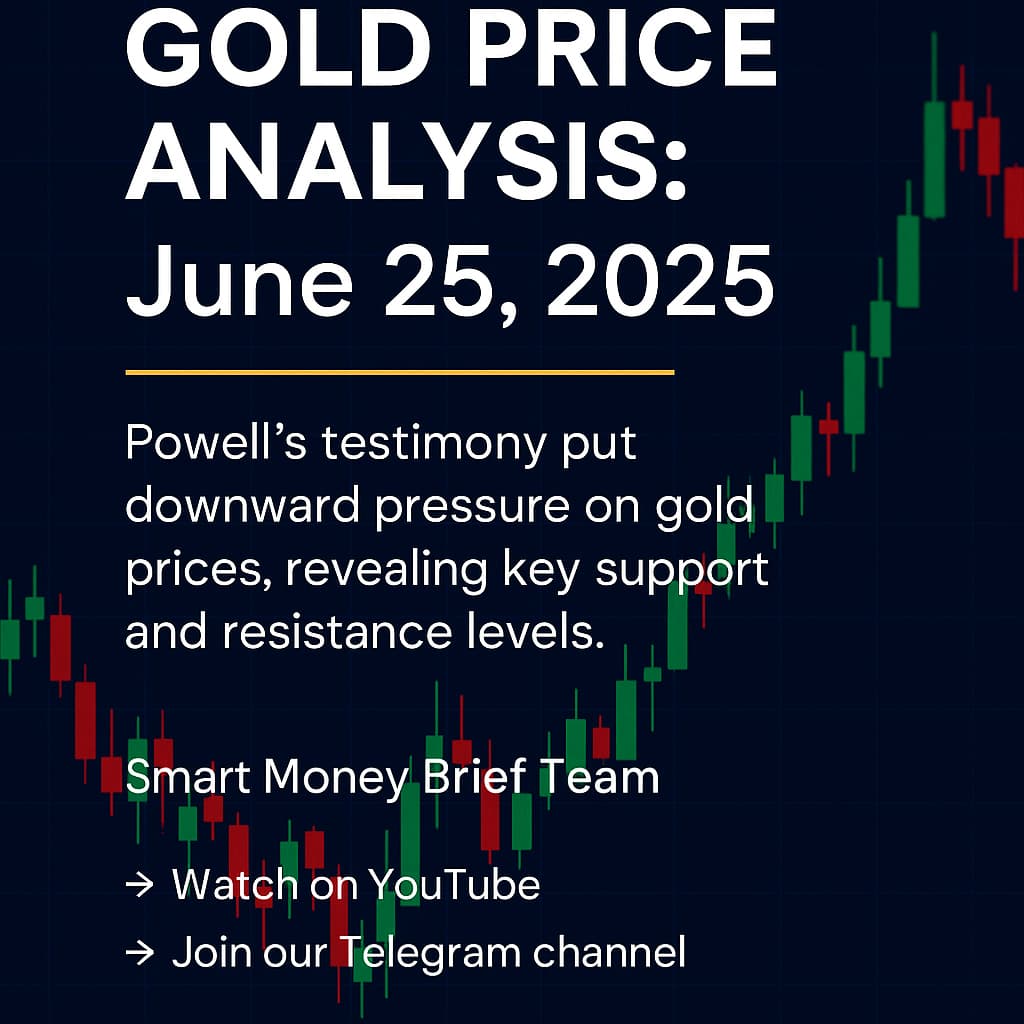
After yesterday’s U.S. market session, gold prices staged another surprising rebound, climbing from around $3,295 to a high of $3,345. As of this morning, prices remain steady near $3,335. So, what should we expect from gold next? There’s a lot to unpack today. Let’s dive right into the heart of the action with the Smart Money Brief Team.
Recap of Recent Market Action
In yesterday’s analysis, we highlighted the potential for further downside in gold prices. At the time, gold was hovering around $3,311, and we anticipated more declines. As expected, prices slipped to $3,296 before bouncing back on news about newly imposed tariffs.
Interestingly, these price moves weren’t widespread across all markets. Rather, gold seemed to overreact. We also noted that prices continued to respect the same key levels we analyze daily, emphasizing the importance of those support and resistance zones.
Key Economic Factors Influencing Gold
Currently, there are no major economic reports expected to shake the markets significantly. The spotlight remains on the new tariff announcements, which triggered yesterday’s volatility. This means we must align fundamental analysis with technical signals to get a clearer picture.
Key Technical Levels to Watch Today
Here are the most crucial levels guiding today’s gold market forecast:
- Pivot Point: $3,335 (current price area)
- Resistance Levels: $3,352, $3,365, $3,382, $3,402
- Support Levels: $3,327, $3,314, $3,296, $3,275, $3,263
What Happened Yesterday?
Yesterday, the market responded to announcements of new tariffs, particularly those targeting Japan and South Korea at rates of roughly 25%. Although gold prices did react, we consider this spike a temporary market disruption.
Why? Because in the past, similar tariffs caused far larger market swings. Yesterday’s reaction was noticeably smaller, suggesting the markets are already adapting. Moreover, many sectors showed signs of recovery, hinting that this spike may not lead to sustained gains.
Limited Impact Across Other Markets
Despite the sudden spike in gold, other assets remained relatively calm. Silver, for example, did not experience any substantial rebound. Oil prices hardly budged, and even the U.S. dollar remained relatively stable.
This cross-market behavior confirms our view: gold’s reaction was likely exaggerated. In fact, as European markets opened today, we haven’t seen any panic-driven buying or sharp price surges, further strengthening this perspective.
Technical Signals Still Point Toward Weakness
Technically, gold lacks the momentum needed for lasting gains. Prices are currently stuck around the pivot point and remain below key resistance levels. Unless gold can break above those resistance points, the bias remains firmly bearish.
Moreover, if prices drop below $3,327, we could see accelerated selling pressure. The next significant target would then be $3,314 a level that acted as a key anchor for most of yesterday’s trading candles.
Watch for These Crucial Levels
If gold breaks below $3,327 and subsequently $3,314, it would likely trigger further declines, potentially dragging prices back toward $3,296. We always emphasize analyzing gold alongside related markets, such as silver, the dollar index, oil, and U.S. equity indices.
Right now, those markets are showing clear signs of recovery. Both the Dow Jones and Nasdaq have regained ground, while the dollar remains steady. This makes it more plausible for gold to revisit lower levels soon.
Strategy Insights for Traders
Given the current setup, we believe that the odds still favor the bears. Both fundamental and technical indicators suggest that recent price gains are temporary, possibly even deceptive.
For traders holding short positions, we suggest targeting $3,314 as an initial profit zone. If your trade reaches this level, consider closing part of the position and moving your stop-loss to breakeven.
Here’s a simple formula for managing multiple trades: Add your entry prices together and divide by the number of trades to get your average entry. Move your stop-loss to this average to protect your profits.
Alternative Perspectives from Trading Central
As always, we also review analysis from Trading Central to offer a balanced view.
When gold traded near $3,333, Trading Central suggested a bullish bias above $3,324, targeting resistance levels at $3,345 and $3,355. However, they warned that a break below $3,324 would reverse the outlook, pointing toward support levels at $3,315 and $3,300.
Similarly, their analysis of silver indicated a bullish trend as long as prices stayed above $36.45. Their upside targets were $36.95 and $37.20, while a drop below $36.45 would signal a bearish shift toward $36.20 or $35.90.
Final Thoughts
To sum up, our analysis suggests that gold’s recent rally is most likely a temporary market disruption rather than the start of a sustained uptrend. While brief spikes may still occur, the broader trend remains negative.
Therefore, we expect gold prices to resume their downward path soon, especially if key support levels break.
Stay cautious, trade smartly, and always respect your risk management strategy.
Want more insights like this?
- Subscribe to our YouTube channel for daily gold updates.
- Join our Telegram channel for instant alerts and trade setups.
This concludes today’s gold market forecast. We’ll be back with more updates soon.
TL;DR: Gold’s recent price surge appears to be a temporary reaction to tariff news. Without strong fundamental or technical support, prices are likely to decline again soon.
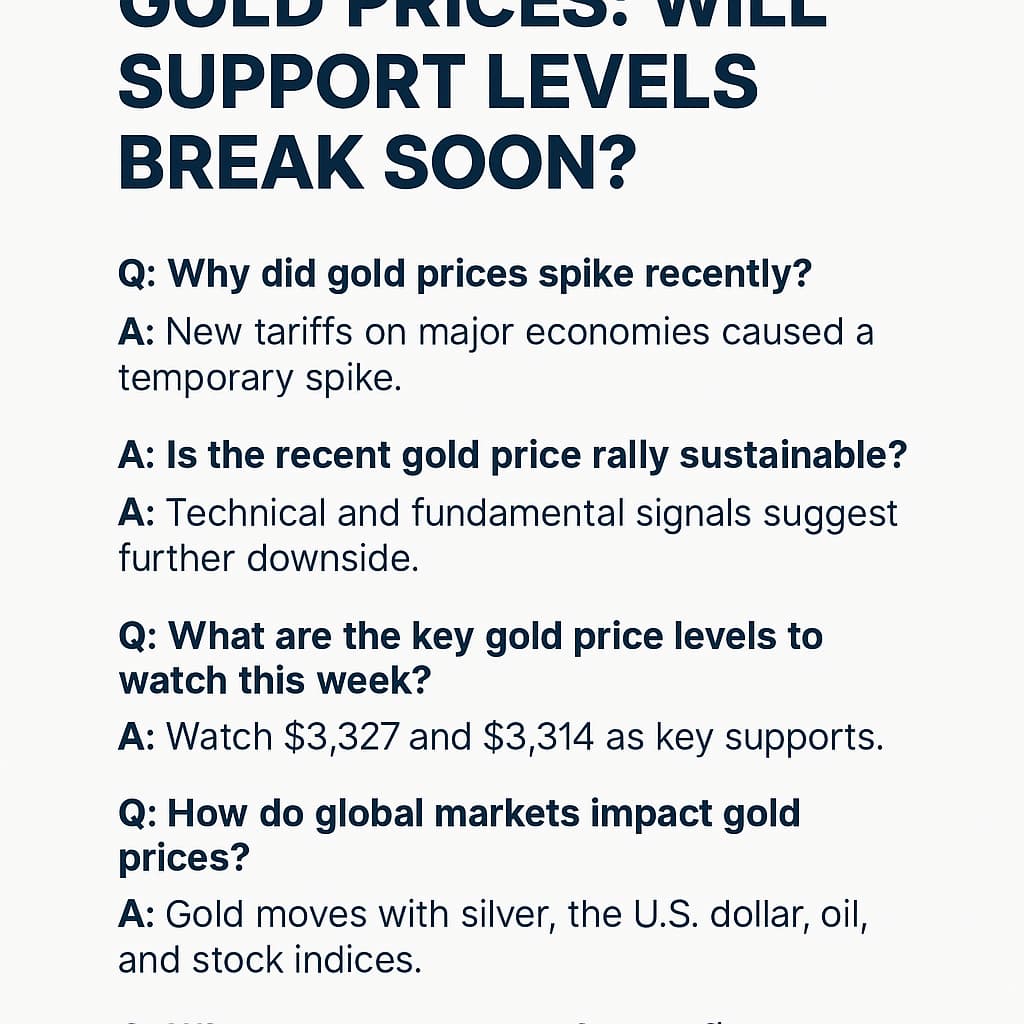
✅ FAQs1. Why did gold prices spike recently?
Gold prices spiked due to newly imposed tariffs on major economies like Japan and South Korea. However, this reaction appears to be temporary, as most other markets didn’t show similar levels of volatility.
2. Is the recent gold price rally sustainable?
Based on technical analysis and broader market trends, the recent gold rally appears to be a short-term reaction rather than a sustainable uptrend. Both fundamental and technical signals suggest further downside is likely.
3. What are the key gold price levels to watch this week?
Key levels include $3,327 and $3,314 as support. A break below these points could accelerate further declines toward $3,296 or lower. On the upside, $3,352 and $3,365 serve as resistance zones.
4. How do global markets impact gold prices?
Gold often moves in relation to other markets, such as silver, the U.S. dollar, oil, and stock indices like the Dow Jones and Nasdaq. Current recovery in these markets suggests limited upside potential for gold.
5. What’s the recommended trading strategy for gold right now?
The recommended approach is cautious. If you are holding short positions, consider targeting $3,314 initially and adjusting your stop-loss to your entry price once that level is reached. Always use proper risk management.